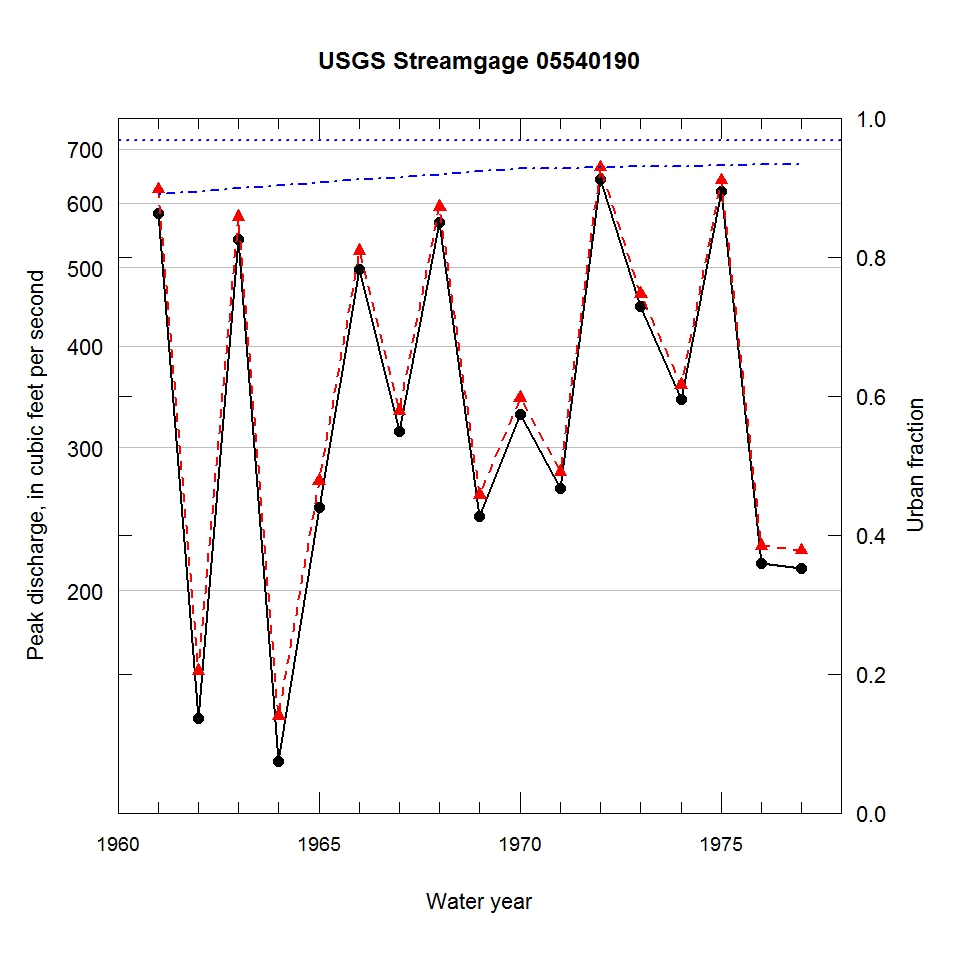
Observed and urbanization-adjusted annual maximum peak discharge and associated urban fraction and precipitation values at USGS streamgage:
05540190 ST. JOSEPH CREEK AT BELMONT, IL


| Water year | Segment | Discharge code | Cumulative reservoir storage (acre-feet) | Urban fraction | Precipitation (inches) | Observed peak discharge (ft3/s) | Adjusted peak discharge (ft3/s) | Exceedance probability |
| 1961 | 1 | -- | 0 | 0.891 | 1.997 | 583 | 624 | 0.061 |
| 1962 | 1 | -- | 0 | 0.895 | 0.288 | 139 | 159 | 0.960 |
| 1963 | 1 | -- | 0 | 0.899 | 1.450 | 542 | 577 | 0.085 |
| 1964 | 1 | -- | 0 | 0.903 | 0.886 | 123 | 140 | 0.975 |
| 1965 | 1 | -- | 0 | 0.907 | 0.843 | 253 | 273 | 0.705 |
| 1966 | 1 | -- | 0 | 0.911 | 1.783 | 497 | 524 | 0.127 |
| 1967 | 1 | -- | 0 | 0.915 | 1.372 | 314 | 333 | 0.503 |
| 1968 | 1 | -- | 0 | 0.919 | 2.065 | 569 | 594 | 0.074 |
| 1969 | 1 | -- | 0 | 0.923 | 1.272 | 247 | 262 | 0.737 |
| 1970 | 1 | -- | 0 | 0.927 | 1.219 | 330 | 345 | 0.467 |
| 1971 | 1 | -- | 0 | 0.928 | 0.868 | 267 | 280 | 0.677 |
| 1972 | 1 | -- | 0 | 0.929 | 2.153 | 642 | 664 | 0.047 |
| 1973 | 1 | -- | 0 | 0.930 | 0.856 | 448 | 464 | 0.186 |
| 1974 | 1 | -- | 0 | 0.931 | 0.983 | 344 | 358 | 0.429 |
| 1975 | 1 | -- | 0 | 0.932 | 1.323 | 620 | 640 | 0.054 |
| 1976 | 1 | -- | 0 | 0.933 | 0.964 | 216 | 227 | 0.838 |
| 1977 | 1 | -- | 0 | 0.934 | 1.121 | 213 | 224 | 0.848 |

